Market Trends Analysis: How to Read the Signals
Market trends analysis is the practice of studying what prices, economic data and investor behaviour are doing so you can make better-informed decisions. It cannot predict the future, but it helps you understand the forces at work, avoid reacting to headlines and compare opportunities more calmly. Below are the main drivers of markets, how to read common signals, and how to use trend analysis without overconfidence.
What a market trend is
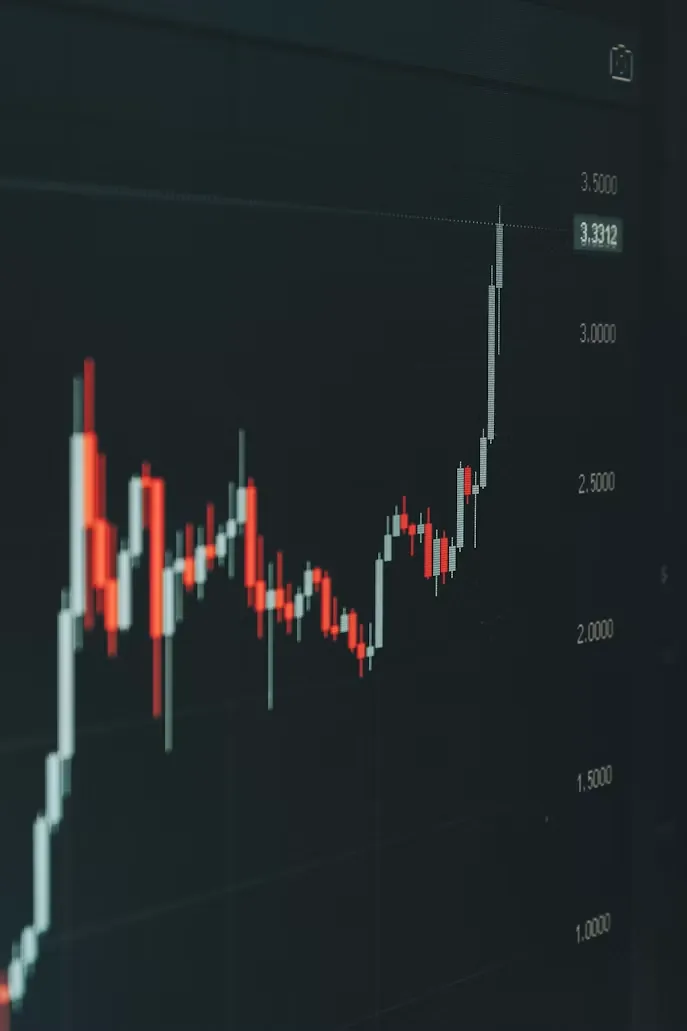
A trend is a general direction in which prices or activity move over time. Analysts usually describe three kinds.
- Uptrend: prices make a series of higher highs and higher lows. Stock markets in this phase are often called bull markets.
- Downtrend: prices make lower highs and lower lows, often called a bear market when declines are large and sustained.
- Sideways trend: prices move within a range without a clear direction.
Trends also come in different time frames. A trend lasting a few days matters to a short-term trader, while a multi-year trend matters more to a long-term investor. Mixing the two up leads to confused decisions.
The main forces behind market trends
Interest rates
Central banks set or influence interest rates. When rates rise, borrowing costs more, savings and bonds pay more, and stock prices can come under pressure because future profits are discounted more heavily. When rates fall, the opposite tends to happen. Rate decisions are among the most closely watched events for this reason.
Inflation
Inflation is the general rise in prices over time. It reduces the buying power of money, influences central bank decisions and can squeeze company profits if costs rise faster than prices. Energy and commodity prices often play an important part.
Economic growth
Strong growth usually supports company earnings and employment. Weak growth or recession can weigh on profits and markets. Data on output, jobs and consumer spending feed into this picture.
Corporate earnings
Over the long run, stock prices follow company profits. Earnings reports show whether businesses are growing, and what management expects.
Geopolitics and supply chains
Trade disputes, conflicts and disruptions to shipping or production can move prices, particularly in energy, food and technology.
Investor sentiment
Markets are driven by people, so fear and optimism matter. Sentiment can push prices well beyond what fundamentals suggest, in both directions.
Sectors and themes
Different parts of the market lead at different times. Technology, healthcare, energy, financials and consumer goods each respond differently to rates, growth and costs. Long-running themes include the growth of artificial intelligence and cloud computing, the shift toward renewable energy and changing consumer habits. Themes can be real and still be a poor investment if prices already assume a great deal of success. A good company can be an expensive stock.
Cryptocurrency and other assets
Crypto markets follow some of the same forces, such as interest rates and risk appetite, but they are also more volatile and less tied to earnings. Bonds, commodities and property each have their own drivers. Comparing how assets behaved in different conditions helps you understand diversification.
Tools analysts use
- Fundamental analysis: studying earnings, revenue, debt and valuation to estimate what an asset is worth.
- Technical analysis: studying price charts and volume for patterns. Its usefulness is debated, so treat it as one input.
- Moving averages: the average price over a period, such as 50 or 200 days, used to smooth noise and show direction.
- Economic indicators: inflation, employment, manufacturing and consumer confidence data.
A simple example
Suppose a stock rose from 100 to 150 in a year, then fell back to 120. A quick glance could suggest a boom followed by a bust. But the long-term view shows a 20% gain over the full period. Meanwhile, if the company’s profit rose 30% during the same time, the price may simply have been adjusting to a fairer value. Context changes the story.
Falls are lopsided, too. If an investment drops 20%, it needs a 25% gain to return to its starting point. These simple calculations help set realistic expectations.
Common mistakes when following trends
- Assuming a trend will continue forever, or that it must reverse soon.
- Buying after a big rise because of fear of missing out.
- Selling in panic after a fall, locking in losses.
- Relying on a single indicator or a single source.
- Ignoring costs, taxes and your own time horizon.
- Taking tips from social media without checking the facts.
How to use market analysis sensibly
- Decide your goals and time horizon first.
- Spread investments across different assets and sectors.
- Invest regularly rather than trying to time the exact top or bottom.
- Keep an emergency fund so you are not forced to sell at a bad time.
- Review your plan periodically, not every hour.
- Use reliable sources and compare views.
Key takeaways
- A market trend is a direction in prices over a given time frame, and time frame matters.
- Interest rates, inflation, growth, earnings, geopolitics and sentiment drive trends.
- Analysis helps you understand conditions, but nobody can predict markets reliably.
- Avoid chasing hot themes and panic selling.
- Diversify and match investments to your goals and time horizon.
FAQ
Can market trends predict future prices?
Not reliably. They show what has happened and help frame risks, but unexpected events regularly change direction.
What is the difference between a bull and a bear market?
A bull market is a sustained period of rising prices, while a bear market is a sustained and significant fall. There is no single official threshold, though a fall of around 20% from a recent high is commonly used.
How often should I check market trends?
Long-term investors usually gain little from daily checking. A periodic review, such as quarterly or yearly, is often enough.
This article is for general education and is not personal financial advice.