How to Read Stock Market News and Index Moves
Stock market news is full of big numbers, red and green arrows and confident predictions. Most of it is noise for a long-term investor, but some of it is useful if you know how to read it. Here is what market indices are, what a daily move really tells you, which drivers matter, and how to follow the news without making rushed decisions.
What a market index tells you
An index is a basket of shares used as a yardstick for a market. Examples include the S&P 500 in the United States, the Sensex and Nifty 50 in India, and the FTSE 100 in the United Kingdom. When a news report says “the market rose 1%”, it usually means the main index of large companies rose by that amount.
Two details are worth knowing. Most indices are weighted by company size, so the largest companies move the index more than smaller ones. And an index covers only a slice of the market, so your own portfolio can behave differently from the headline number.
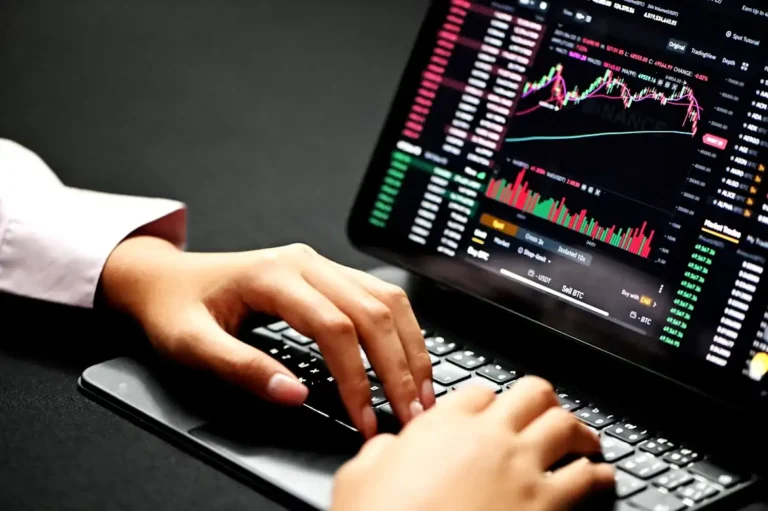
How to read a daily market summary
A typical report lists the index level, the change in points and the change in percent, plus top gainers and losers. Percent is the figure to focus on, because points depend on the index level. Take a 250-point move (index levels here are illustrative). On an index at 25,000 that is 1%, but on one at 75,000 it is only about 0.33%.
- Index change: shows the general direction of large companies that day.
- Gainers and losers: show which stocks or sectors drove the move, often because of company news.
- Sector performance: shows whether the move was broad or concentrated in a few industries.
- Volume: heavy trading on a big move suggests stronger conviction than a move on thin volume.
A single day rarely changes the long-term picture. Moves of a percent or so in either direction are common on any given day.
What actually drives stock prices
Company earnings
Over long periods, share prices follow business profits. Quarterly results, guidance for the next period and changes in margins often cause sharp moves in individual stocks.
Interest rates and inflation
Central bank decisions affect borrowing costs and the appeal of safer assets such as bonds. When rates rise, future profits are worth less today and share prices often come under pressure. Falling rates tend to help, although the effect is not automatic.
Economic data
Employment, growth, consumer spending and manufacturing figures shape expectations for profits and for central bank policy.
Global events and sentiment
Wars, elections, trade disputes and sudden shocks can move markets quickly. Sentiment also matters: fear can push prices below what company fundamentals suggest, and optimism can push them above.
Foreign and institutional flows
In many markets, large inflows or outflows from foreign investors and funds can move indices noticeably in the short term.
Why forecasts deserve caution
Headlines often include predictions such as “the index will reach X by year-end”. Even professionals get these wrong regularly, because markets respond to events nobody can foresee. Treat forecasts as opinions, ask what assumptions they rely on and who benefits from the message. A good habit is to look at the track record of the person making it.
Historical comparisons need care too. Saying an index is up 15% on a year ago depends heavily on the start date chosen, and says little about the next year.
A calm way to follow market news
- Decide how often you will check, for example weekly, rather than reacting to every move.
- Focus on your plan: your goals, time horizon and asset mix matter more than today’s headline.
- Use news to learn about companies and the economy, not to time trades.
- Prefer primary sources such as company filings, central bank statements and exchange data over social media posts.
- Be sceptical of urgency: “buy now before it’s too late” is a classic sales tactic.
- Keep investing regularly through ups and downs instead of trying to guess tops and bottoms.
A simple example
Imagine you invest 1,000 each month in a broad index fund. In a month when the market falls 5%, your 1,000 buys more units than in a month when prices are higher. Over many years this routine, often called averaging, takes the stress out of timing. It does not guarantee profits, but it avoids the common mistake of selling in a panic and buying back after prices have recovered.
Key takeaways
- An index is a yardstick for a group of shares, not the whole market.
- Read percentage moves, not just points, and treat single-day changes as noise.
- Earnings, interest rates, economic data and sentiment are the main drivers of prices.
- Predictions are opinions; be careful with confident forecasts.
- A regular investing plan beats reacting to headlines.
Frequently asked questions
What does it mean when the market is up or down?
It means the main index of large companies has risen or fallen compared with the previous close. Your own investments may have moved differently depending on what you hold.
Should I sell when the market falls?
Not automatically. Falls are a normal part of investing, and selling in a panic locks in losses. If you will need the money soon, though, it should not have been in stocks in the first place.
How often should I check my investments?
For long-term goals, a periodic review such as once or twice a year is usually enough. Checking daily tends to increase stress and impulsive trades without improving returns.
This article is for general education and is not personal financial advice.