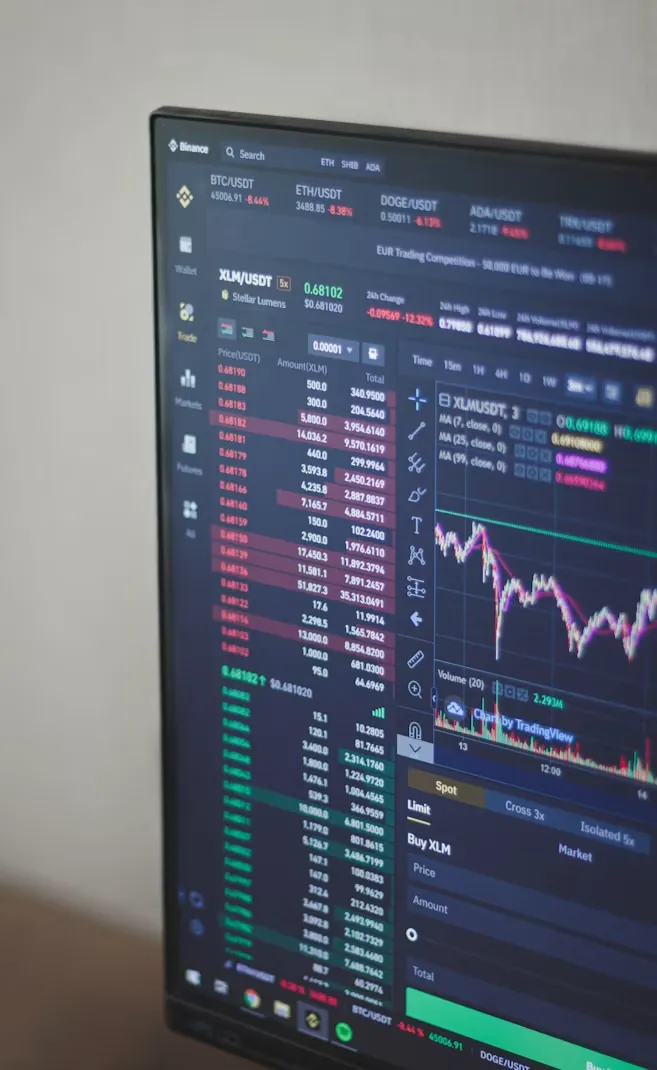

What Is a Trend Line? Visualizing the Direction of Price Movement
A trend line is a straight line drawn on a price chart connecting a series of price points — typically successive lows in an uptrend or successive highs in a downtrend — used to visually represent the direction and general angle of a security's price movement over a given period.
How to Draw a Basic Trend Line
For an uptrend, a trend line is typically drawn connecting two or more successive higher lows, forming a rising line beneath the price action that can act as a visual guide for the trend's support. For a downtrend, a trend line connects two or more successive lower highs, forming a descending line above the price action that can act as a visual reference for resistance during the decline.
The more times a price touches and respects a trend line without breaking through it, the more significant that trend line is generally considered by technical analysts, since it reflects a more consistently observed pattern of behavior.
What a Trend Line Can Reveal
Trend direction and strength are the most direct information a trend line conveys — a steeply angled trend line suggests a strong, fast-moving trend, while a more gently angled line suggests a slower, more gradual trend. Potential support or resistance is another common use, similar to horizontal support and resistance levels, but applied to a diagonal, trending price pattern rather than a flat price zone.
Trend line breaks are often watched closely by traders as potential signals of a trend weakening or reversing — a price breaking below an established uptrend line, for instance, might suggest the uptrend is losing momentum or ending.
Limitations of Trend Lines
Drawing trend lines involves a degree of subjectivity — different analysts might connect slightly different price points and arrive at somewhat different trend lines for the same chart, which is a common criticism of this and other visual technical analysis tools. Trend lines also work best in markets showing a relatively clear directional trend, and are less useful during periods of sideways, range-bound price movement.
FAQ
How many points are needed to draw a valid trend line? Technically, two points are enough to draw a line, but most technical analysts prefer to see a third point touch and respect the line before considering it a more reliable, validated trend line.
Do trend lines work the same way across all time frames? The basic principle applies across time frames — from very short-term intraday charts to long-term weekly or monthly charts — though trend lines drawn on longer time frames are often considered more significant than those on very short-term charts.
A trend line offers a simple visual way to track a security's directional movement and identify potential support, resistance, or reversal points, though its somewhat subjective nature means it works best alongside other technical analysis tools rather than in isolation. This is general information, not personalized investment advice.
Sources
- National Stock Exchange of India — nseindia.com
- Securities and Exchange Board of India — sebi.gov.in