
What Is Technical Analysis? Reading Price Charts to Predict Moves
Technical analysis is an approach to evaluating securities that relies on studying historical price movement and trading volume, using charts and statistical indicators, to identify patterns that might suggest future price direction — in contrast to fundamental analysis, which focuses on a company's underlying financial health and business prospects.
The Core Assumptions Behind Technical Analysis
Technical analysis generally rests on a few core assumptions: that market prices reflect all available information (so studying price action itself is sufficient, without needing to separately analyze company fundamentals), that prices tend to move in identifiable trends, and that historical price patterns tend to repeat over time due to consistent patterns in market participant behavior and psychology.
Common Tools Used in Technical Analysis
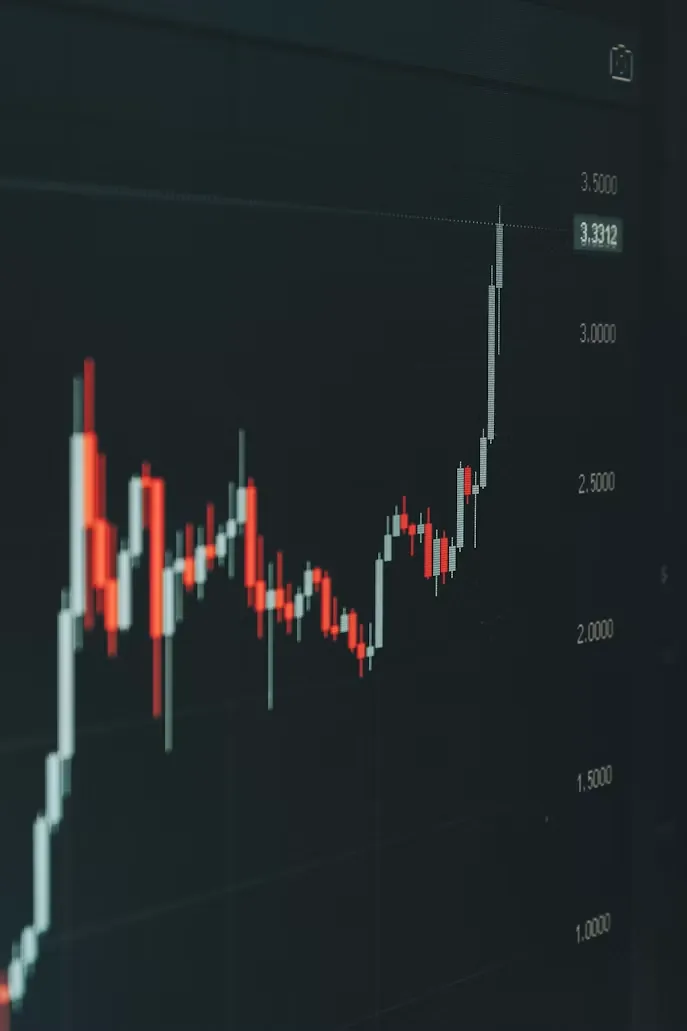
Chart patterns, such as candlestick formations, help traders visualize price action over specific time periods and identify potential reversal or continuation signals. Trend lines and support/resistance levels help identify price zones where a stock has historically found buying or selling pressure, informing potential entry and exit points. Technical indicators, like moving averages, help smooth out price data to identify the underlying trend direction, while momentum indicators attempt to gauge the strength or weakness behind a price move.
Why Traders Use Technical Analysis
Technical analysis is particularly popular among short-term traders — day traders and swing traders — since it focuses specifically on price action and timing rather than a company's longer-term fundamental value, which is less relevant to a trade expected to be held for hours, days, or weeks rather than years.
Criticisms and Limitations of Technical Analysis
Critics argue that technical analysis patterns can be somewhat subjective, with different analysts sometimes interpreting the same chart differently, and that some patterns may reflect genuine recurring market psychology while others could simply be the result of pattern-seeking in essentially random price movement. Most practitioners acknowledge that technical analysis isn't a guaranteed predictive tool, but rather one input among several — often combined with risk management and, in some cases, fundamental context — for making trading decisions.
FAQ
Is technical analysis more reliable than fundamental analysis? Neither approach is universally more reliable — they serve different purposes and time horizons, with technical analysis generally more relevant for shorter-term trading decisions and fundamental analysis more relevant for longer-term investment decisions.
Can technical analysis be used for any asset, not just stocks? Yes, technical analysis principles are commonly applied across various asset classes, including currencies, commodities, and cryptocurrencies, since the core methodology focuses on price and volume data rather than asset-specific fundamentals.
Technical analysis offers a structured framework for studying price action and market psychology, particularly useful for shorter-term trading decisions, though it works best as one input among several rather than a standalone predictive guarantee. This is general information, not personalized investment advice.
Sources
- National Stock Exchange of India — nseindia.com
- Securities and Exchange Board of India — sebi.gov.in