
What Is a Candlestick Chart? Reading Price Action Visually
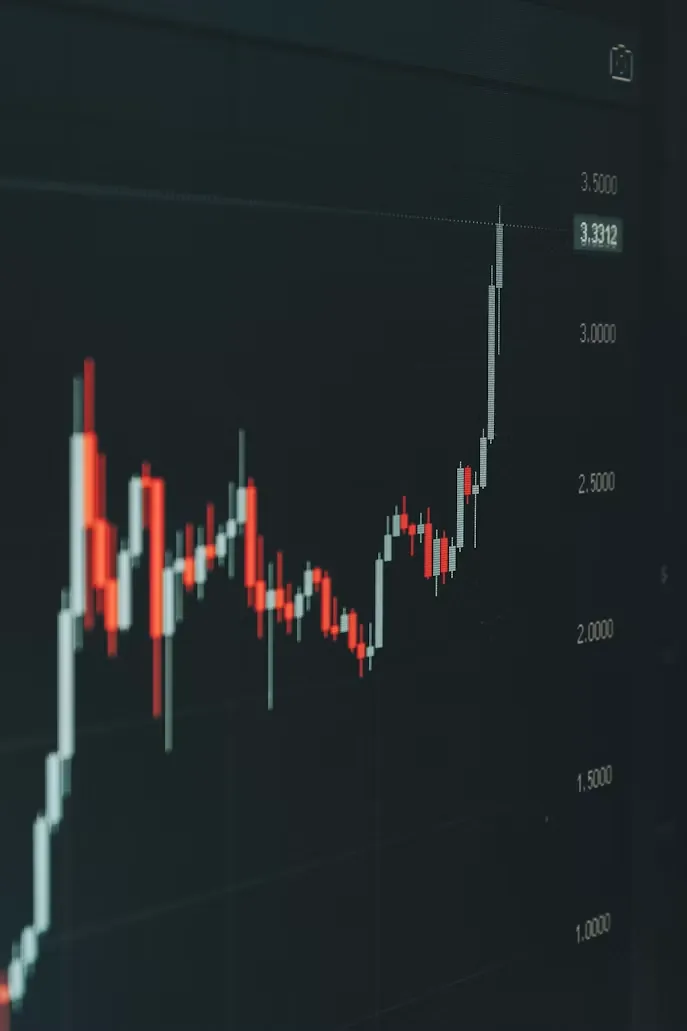
A candlestick chart is a widely used method of visualizing a security's price movement over a specific time period, with each "candle" displaying four key data points — the opening price, closing price, high, and low — for that period, whether it's a minute, an hour, a day, or longer.
How to Read a Single Candlestick
Each candlestick has a rectangular "body" representing the range between the opening and closing price, and thin lines extending above and below (called wicks or shadows) representing the highest and lowest prices reached during that period. A candle where the closing price is higher than the opening price is typically shown in one color (often green), indicating the price rose during that period, while a candle where the closing price is lower than the opening is typically shown in another color (often red), indicating the price fell.
The length of the body and wicks conveys additional information — a long body suggests strong directional movement during that period, while long wicks suggest significant price movement in one direction that was ultimately reversed before the period closed.
Why Traders Use Candlestick Charts
Candlestick charts pack more information into a single visual data point than a simple line chart, which typically only shows closing prices. This richer visual detail helps traders quickly assess not just the direction of price movement, but the intensity and any reversal activity within each period, which is particularly useful input for technical analysis.
Common Candlestick Patterns
Traders often look for specific recurring patterns — formed by one or several consecutive candles — believed to signal potential reversals or continuations in price trend. Patterns like a "doji" (indicating indecision, where opening and closing prices are very close) or a "hammer" (suggesting a potential reversal after a decline) are commonly referenced examples, though interpreting these patterns reliably requires experience and, importantly, should generally be considered alongside other technical and market context rather than in isolation.
FAQ
Are candlestick charts only used for stocks? No, candlestick charts are widely used across virtually all tradable financial instruments, including currencies, commodities, and cryptocurrencies, since the underlying open-high-low-close data structure applies broadly.
Do candlestick patterns guarantee a specific price outcome? No, candlestick patterns suggest probabilities and tendencies based on historical observation, not guarantees, and should generally be used alongside other analysis tools rather than as a standalone predictive signal.
Candlestick charts offer a richer, more visually informative way to track price action than simple line charts, forming a foundational tool for traders practicing technical analysis, though patterns should be interpreted as probabilistic signals rather than certainties. This is general information, not personalized investment advice.
Sources
- National Stock Exchange of India — nseindia.com
- Securities and Exchange Board of India — sebi.gov.in